Section 3.1: Measures of Central Tendency
Objectives
By the end of this lesson, you will be able to...
- determine the arithmetic mean of a variable from raw data
- determine the median of a variable from raw data
- explain what it means for a statistics to be resistant
- determine the mode of a variable from raw data
- use the mean and median to help identify the shape of a distribution
It's often very helpful to get a sense of what a "typical" individual might be in a population. This is what we mean when we say we're looking at measures of "center" or "central tendency".
For a quick overview of this section, watch this short video summary:
Before we get into specifics, we need to clarify whether we're talking about typical individual from a population or from a sample.
A parameter is a descriptive measure of a population.
A statistic is a descriptive measure of a sample.
Arithmetic Mean
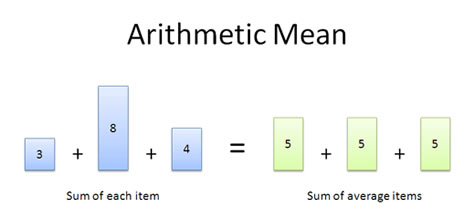
You already know the arithmetic mean, though maybe not by name. It's more commonly referred to as the "average". It's calculated just by finding the some of the values and dividing by the number of observations. As mentioned above, we'll have two different means - one for the population and one if we're talking about a sample.
The population arithmetic mean, μ (pronounced "mew"),
is computed using all the individuals in the population. The sample arithmetic mean, ![]() (pronounced "x-bar"),
is computed using sample data.
(pronounced "x-bar"),
is computed using sample data.
| population arithmetic mean: | μ = | x1 + x + ... + xN | = | Σxi |
| N | N |
| sample arithmetic mean: | x1 + x + ... + xn | = | Σxi | |
| n | n |
This is pretty formulaic, but the concept should be relatively familiar.
To give another explanation, I'm going to reference one of my favorite web sites, BetterExplained. The author, Kalid Azad, presents topics in a non-traditional way, and I feel it's much more accessible and easier to understand than traditional texts. Here's what Kalid writes about the arithmetic mean:
The Arithmetic Mean
The arithmetic mean is the most common type of average:


Let’s say you weigh 150 lbs, and are in an elevator with a 100lb kid and 350lb walrus. What’s the average weight?
The real question is “If you replaced this merry group with 3 identical people and want the same load in the elevator, what should each clone weigh?”
In this case, we’d swap in three people weighing 200 lbs each [(150 + 100 + 350)/3], and nobody would be the wiser.
Pros:
- It works well for lists that are simply combined (added) together.
- Easy to calculate: just add and divide.
- It’s intuitive — it’s the number “in the middle”, pulled up by large values and brought down by smaller ones.
Cons:
- The average can be skewed by outliers — it doesn’t deal well with wildly varying samples. The average of 100, 200 and -300 is 0, which is misleading.
The arithmetic mean works great 80% of the time; many quantities are added together. Unfortunately, there’s always those 20% of situations where the average doesn’t quite fit.
Source: BetterExplained,
Kalid Azad
Article: How
to Analyze Data Using the Average
Used with permission.
So, let's try an example.
Example 1
Suppose we record the exam scores from a sample of six students from a class of 30 (see table below).
| student | exam score |
| Joseph | 62 |
| Alicia | 83 |
| Kendra | 77 |
| Cheryl | 92 |
| Adrian | 89 |
| Brian | 75 |
Find the sample mean, along with its appropriate symbol.
Since this is a sample, the appropriate symbol is ![]() ,
with a value of:
,
with a value of:
| 62 + 83 + 77 + 92 + 89 + 75 | = | 478 | ≈79.7 | |
| 6 | 6 |
You may notice that I rounded the mean to the tenths place.
Typically, we round the mean to one more digit than the original data.
When necessary, round the mean to one more
digit than the original data. i.e. If the data are whole numbers,
you should round the mean to
the tenths place (as in the previous example). If the data are already
to the tenths place, you should round to the hundredths place.
You might also consider watching this video regarding rounding (in Quicktime or iPod format).
Example 2
One point that should be emphasized again is the effect of outliers on the arithmetic mean. Because it adds all the values together, the arithmetic mean can be skewed by extremely large or extremely small values.
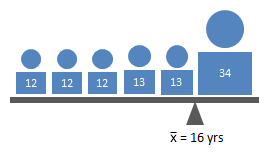
A helpful way to illustrate this is to think of the mean as the center of gravity - like the balance point. Suppose we consider the ages of the six Jackson cousins, Hudson, Abella, Amelia, Jillian, Katelyn, and Jessica. The figure below represents their ages and the corresponding sample mean. (Sample, in this case, because this isn't all of the Jackson cousins.)

If we replace Jessica with her father, who is 34 years old, we get something like this:

You can see very clearly here the effect of including the dad. 16 years old does not really represent the "middle" value.
Technology
Here's a quick overview of the formulas for finding arithmetic mean in StatCrunch.
|
| You can also visit the video page for links to see videos in either Quicktime or iPod format. |
Median
As we mentioned at the end of the previous page, we need another measure of center when the data include outliers. The most common choice is called the median.
The median of a variable is the value that lies in the middle of the data when arranged in ascending order. That is, half the data are below the median and half the data are above the median. We use M to represent the median.
Like the previous topic, I really appreciate how Kalid Azad explained the median on his web site, BetterExplained. Here's what he wrote:
Median
The median is “the item in the middle”. But doesn’t the average (arithmetic mean) imply the same thing? What gives?
Humor me for a second: what’s the “middle” of these numbers?
- 1, 2, 3, 4, 100
Well, 3 is the middle of the list. And although the average (22) is somewhere in the “middle”, 22 doesn’t really represent the distribution. We’re more likely to get a number closer to 3 than to 22. The average has been pulled up by 100, an outlier.
The median solves this problem by taking the number in the middle of a sorted list. If there’s two middle numbers (even number of items), just take their average. Outliers like 100 only tug the median along one item in the sorted list, instead of making a drastic change: the median of 1 2 3 4 is 2.5.

Pros:
- Handles outliers well — often the most accurate representation of a group
- Splits data into two groups, each with the same number of items
Cons:
- Can be harder to calculate: you need to sort the list first
- Not as well-known; when you say “median”, people may think you mean “average”
Some jokes run along the lines of “Half of all drivers are below average. Scary, isn’t it?”. But really, in your head, you know they should be saying “half of all drivers are below median“.
Figures like housing prices and incomes are often given in terms of the median, since we want an idea of the middle of the pack. Bill Gates earning a few billion extra one year might bump up the average income, but it isn’t relevant to how a regular person’s wage changed. We aren’t interested in “adding” incomes or house prices together — we just want to find the middle one.
Again, the type of average to use depends on how the data is used.
Source: BetterExplained,
Kalid Azad
Article: How
to Analyze Data Using the Average
Used with permission.
Example 3
Let's again consider the exam scores from a sample of six students from a class of 30 (see table below).
| student | exam score |
| Joseph | 62 |
| Alicia | 83 |
| Kendra | 77 |
| Cheryl | 92 |
| Adrian | 89 |
| Brian | 75 |
Find the sample median.
In order to find the median, we first need to write the values in order: 62, 75, 77, 83, 89, 92. Since we have six observations, there is no exact "middle" on, so we have to average the middle two.
The median is then (77 + 83)/2 = 80.
Example 4
To illustrate how the median deals with outliers, let's again consider the ages of the six Jackson cousins. The figure below represents their ages and the corresponding sample median.

If we replace Jessica with her father, who is 34 years old, we get something like this:

You can immediately see the benefit of using the median - it is not affected by the age of Jessica's father.
Technology
Here's a quick overview of the formulas for finding median in StatCrunch.
|
| You can also visit the video page for links to see videos in either Quicktime or iPod format. |
Mode
Often, we just want to know what "most" people think on an issue. We don't call it that, but we're really looking at is called the mode.
The mode of a variable is the most frequent observation of the variable.
Look at any poll from the Pew Research Center. Any time an article discusses the "most common" or "most popular" choice, it's talking about the mode.
As with the previous two measures of central tendency, I like Kalid Azad's explanation of the mode on his web site, BetterExplained. Here's what he wrote:
Mode
The mode sounds strange, but it just means take a vote. And sometimes a vote, not a calculation, is the best way to get a representative sample of what people want.
Let’s say you’re throwing a party and need to pick a day (1 is Monday and 7 is Sunday). The “best” day would be the option that satisfies the most people: an average may not make sense. (“Bob likes Friday and Alice likes Sunday? Saturday it is!”).
Similarly, colors, movie preferences and much more can be measured with numbers. But again, the ideal choice may be the mode, not the average: the “average” color or “average” movie could be… unsatisfactory (Rambo meets Pride and Prejudice).

Pros:
- Works well for exclusive voting situations (this choice or that one; no compromise)
- Gives a choice that the most people wanted (whereas the average can give a choice that nobody wanted).
- Simple to understand
Cons:
- Requires more effort to compute (have to tally up the votes)
- “Winner takes all” — there’s no middle path
The term “mode” isn’t that common, but now you know what button to look for when playing around with your favorite statistics program.
Source: BetterExplained,
Kalid Azad
Article: How
to Analyze Data Using the Average
Used with permission.
Technology
To see how to find the mode using technology, open the appropriate video from the list below. These videos include all measures of center included in this section, plus other descriptive statistics.
| Visit the video page for links to see videos in either Quicktime or iPod format. |
Using the Mean and Median to Identify the Distribution Shape
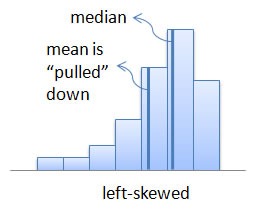
In Section 2.2, we talked about different ways to describe the distribution shape. With these new measures of center, we can now use the mean and median to get an idea of the distribution shape as well.


