Chapter 7: The Normal Probability Distribution

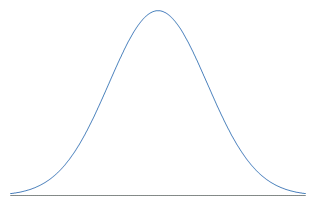
In Chapter 7, we bring together much of the ideas in the previous two on probability. We expand the earlier bell-shaped distribution (we introduced this shape back in Section 2.2) to its more formal name of a normal curve.
Many random variables have histograms that follow the normal curve, like an individuals height, the thickness of tree bark, IQs, or the amount of light emitted by a light bulb. This is helpful, because we can use it to answer all kinds of interesting questions.
- What proportion of individuals are geniuses?
- Is a systolic blood pressure of 110 unusual?
- What percentage of a particular brand of light bulb emits between 300 and 400 lumens?
- What is the 90th percentile for the weights of 1-year-old boys?
If you're ready to begin, just click on the "start" link below, or one of the section links on the left.

