Section 10.4: Hypothesis Tests for a Population Standard Deviation
Objectives
By the end of this lesson, you will be able to...
- test hypotheses about a population standard deviation
For a quick overview of this section, watch this short video summary:
Before we begin this section, we need a quick refresher of the Χ2 distribution.
The Chi-Square (Χ2) distribution
Reminder: "chi-square" is pronounced "kai" as in sky, not "chai" like the tea.
The Chi-Square (Χ2) distribution
If a random sample size n is obtained from a normally distributed population with mean μ and standard deviation σ, then
![]()
has a chi-square distribution with n-1 degrees of freedom.

Properties of the Χ2 distribution
- It is not symmetric.
- The shape depends on the degrees of freedom.
- As the number of degrees of freedom increases, the distribution becomes more symmetric.
- Χ2≥0
Finding Probabilities Using StatCrunch
Click on Stat > Calculators >Chi-Square Enter the degrees of freedom, the direction of the inequality, and X. Then press Compute. |
We again have some conditions that need to be true in order to perform the test
- the sample was randomly selected, and
- the population from which the sample is drawn is normally distributed
Note that in the second requirement, the population must be normally distributed. The steps in performing the hypothesis test should be familiar by now.
Performing a Hypothesis Test Regarding σ
Step 1: State the null and alternative hypotheses.
| Two-Tailed H0: σ = σ0 H1: σ ≠ σ0 |
Left-Tailed H0: σ = σ0 H1: σ < σ0 |
Right-Tailed H0: σ = σ0 H1: σ > σ0 |
Step 2: Decide on a level of significance, α.
Step 3: Compute the test statistic, ![]() .
.
Step 4: Determine the P-value.
Step 5: Reject the null hypothesis if the P-value is less than the level of significance, α.
Step 6: State the conclusion.
Example 1
In Example 2, in Section 10.2, we assumed that the standard deviation for the resting heart rates of ECC students was 12 bpm. Later, in Example 2 in Section 10.3, we considered the actual sample data below.
| heart rate | ||||
| 61 | 63 | 64 | 65 | 65 |
| 67 | 71 | 72 | 73 | 74 |
| 75 | 77 | 79 | 80 | 81 |
| 82 | 83 | 83 | 84 | 85 |
| 86 | 86 | 89 | 95 | 95 |
(Click here to open the data in StatCrunch.)
Based on this sample, is there enough evidence to say that the standard deviation of the resting heart rates for students in this class is different from 12 bpm?
Note: Be sure to check that the conditions for performing the hypothesis test are met.
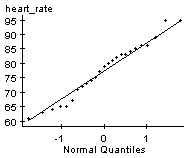
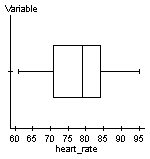
From the earlier examples, we know that the resting heart rates could come from a normally distributed population and there are no outliers.


Step 1:
H0: σ = 12
H1: σ ≠ 12
Step 2: α = 0.05
Step 3: ![]()
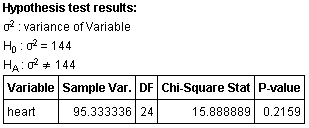
Step 4: P-value = 2P(Χ2 > 15.89) ≈ 0.2159
Step 5: Since P-value > α, we do not reject H0.
Step 6: There is not enough evidence at the 5% level of significance to support the claim that the standard deviation of the resting heart rates for students in this class is different from 12 bpm.
Hypothesis Testing Regarding σ Using StatCrunch
|
Example 2
Let's look at Example 1 again, and try the hypothesis test with technology.
Using StatCrunch:

