Section 6.1: Discrete Random Variables
Objectives
By the end of this lesson, you will be able to...
- distinguish between discrete and continuous random variables
- identify discrete probability distributions
- construct probability histograms
- compute and interpret the mean of a discrete random variable
- interpret the mean of a discrete random variable as an expected value
- compute the variance and standard deviation of a discrete random variable*
* You will not be tested on this objective.
For a quick overview of this section, watch this short video summary:
Random Variables
Many probability experiments can be characterized by a numerical result. In Example 1, from Section 5.1, we flipped three coins. Instead of looking at particular outcomes (HHT, HTT, etc.), we might instead be interested in the total number of heads. Something like this:
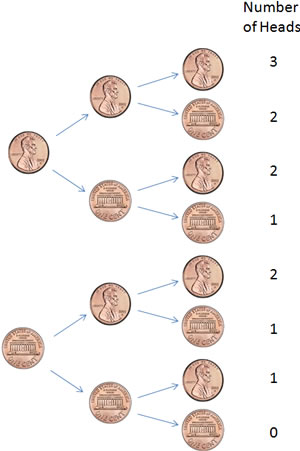
In this case, the number of heads is called a random variable.
A random variable is a numerical measure of the outcome of a probability experiment whose value is determined by chance.
Example 1
Another example might be when we roll two dice, as in Example 2, from Section 5.1. Rather than looking at the dice individually, we can instead look at the sum of the dice, which would be a random variable.
In this case, if we let X = the sum of the two dice, x = 2, 3, 4, ..., 12. (We usually use a capital X to represent the random variable, and a lower case x to represent the particular values it can take on.)
One common goal with random variables is to know what the probability of each value is. This is called a probability distribution.
The probability distribution of a discrete random variable X provides the possible value of the random variable along with their corresponding probabilities. A probability distribution can be in the form of a table, graph, or mathematical formula.
Let's look at the earlier coin example to illustrate.
Example 2
If we flip three fair coins and let X = the number of heads, we know that x = 0, 1, 2, 3. We also know that since the coin is fair, each of the strands in the tree diagram shown earlier is equally likely. Since there are 8 total outcomes (HHH, HHT, HTH, etc), the probability distribution would look something like this:
| x | P(x) |
| 0 | 1/8 |
| 1 | 3/8 |
| 2 | 3/8 |
| 3 | 1/8 |
You'll notice that if we find the sum of the P(x) values, we get 1.
Why don't you try an example now:
Example 3
Consider again the probability experiment where a fair six-sided die is rolled twice, and X = the sum of the two dice. Find the probability histogram for X.
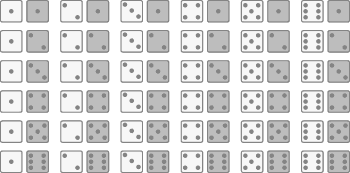
From earlier, we know x = 2, 3, 4, ... , 12. We also know that each of the outcomes in the graphic are equally likely, so a probability distribution would look something like the following:
| x | P(x) |
| 2 | 1/36 |
| 3 | 2/36 = 1/18 |
| 4 | 3/36 = 1/12 |
| 5 | 4/36 = 1/9 |
| 6 | 5/36 |
| 7 | 6/36 = 1/6 |
| 8 | 5/36 |
| 9 | 4/36 = 1/9 |
| 10 | 3/36 = 1/12 |
| 11 | 2/36 = 1/18 |
| 12 | 1/36 |
Probability Histograms
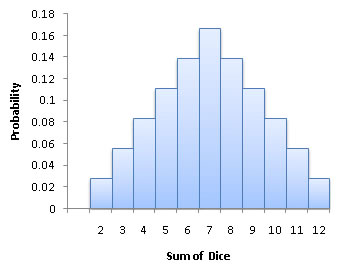
A probability histogram is similar to a histogram for single-valued discrete data from Section 2.2, except the height of each rectangle is the probability rather than the frequency or relative frequency.
Example 4
Looking again at the previous example about rolling two dice, the probability histogram would look something like this:
Since random variables represent numbers, it seems reasonable that we should be able to find the mean of those numbers, much like we did in Section 3.1. In fact, we can, but it has a much different meaning in this new context.
The Mean of a Random Variable
Let's consider our example again with the two dice.

We know x = 2, 3, 4, ... , 12, but there aren't equal numbers of each. If we were to calculate the mean of x like we usually would, we'd get something like this:
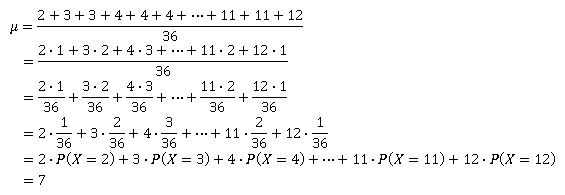
What an interesting result! In fact, this isn't coincidental. The mean of a random variable will always be the sum of the values of the random variable multiplied by their corresponding probabilities. More formally:
The Mean of a Discrete Random Variable
The mean of a discrete random variable is given by the formula
![]()
where x is the value of the random variable and P(x) is the probability of observing the random variable x.
All right, let's try one.
Example 5
Let's go back to the three coins again. If we flip three fair coins and let X = the number of heads, what is the mean of X?
From Example 2 earlier this section, we have the probability distribution:
| x | P(x) |
| 0 | 1/8 |
| 1 | 3/8 |
| 2 | 3/8 |
| 3 | 1/8 |
The expected value is then:
![]()
Expected Value
So what does the mean of a random variable actually ... mean? When we found a mean of 7 in the example above, it certainly didn't mean that we'll get 7 every time. And it doesn't mean that our average after say 20 rolls will be 7.
No - the mean of a random variable is like a long-term expectation. Think of the mean being what to expect in the long run. In fact, the mean is usually referred to as the expected value of the random variable. If we continue throwing the two dice in the earlier example, our long-term average will get closer and closer to 7. In Example 5, the more times we toss three coins, the closer our long-term average will approach 1.5.
Expected values are used in lots of calculations in the business and finance world. Poker players use expected values to help make decisions on whether to continue playing in a hand. Hopefully by the end of this section, you'll use the idea of expected value to not play games of chance like roulette!
Technology
Here's a quick overview of how to compute expected values in StatCrunch.
|
Let's illustrate with some examples.
Example 6
In the game of roulette, a wheel consists of 38 slots numbered 0, 00, 1, 2, … , 36. To play the game, a metal ball is spun around the wheel and is allowed to fall into one of the numbered slots. A dozen bet is betting that one of a particular dozen numbers hits on the next spin of the wheel. The wheel is divided into 3 different groups; 1-12, 13-24, and 25-36. If the payout for a dozen bet is 2 to 1 (the original bet is returned, along with twice its value), what is the expected value of $1 dozen bet?
Solution: To solve this problem, let's first define a random variable. In a situation like this, we typically let X = amount won. X can then take on values of either -$1 (we lose) or +$2 (we get our $1 plus $2 more).
P(X = 2) = 12/38, since there are 12 ways to land on our dozen (regardless of which dozen we choose), and
P(X = -1) = 26/38, since there are 26 other numbers
The expected value of X is then:
E(X) = (-1)•P(X = -1) + (2)•P(X = 2)
= (-1)(26/38) + (2)(12/38)
= -2/38 ≈ -$0.05
So on average, we expect to lose 5¢ for every $1 bet we make. Of course, this doesn't mean we'll lose 5¢ every time - just that in the long run, we'll average a loss of 5¢ per $1 bet.
You can see examples of other Roulette expected values here.
Example 7
Consider a car owner who has an 80% chance of no accidents in a year, a 20% chance of being in a single accident in a year, and no chance of being in more than one accident in a year.
For simplicity, assume that there is a 50% probability that after the accident the car will need repairs costing $500, a 40% probability that the repairs will cost $5,000, and a 10% probability that the car will need to be replaced, which will cost $15,000.
What is the expected loss for the car owner per year?
Solution: This one is a little trickier. If we let X = loss for the year, X can be $0, $500, $5,000, or $15,000. P(X=0) = 0.8, but P(X = $500) is actually (0.2)(0.5), since there's a 20% chance of being in an accident, and a 50% chance of that accident causing repair costs of $500. The complete list of X and its corresponding values is:
| x | P( X= x) |
| $0 | 0.80 |
| $500 | (0.2)(0.5) = 0.1 |
| $5,000 | (0.2)(0.4) = 0.08 |
| $15,000 | (0.2)(0.1) = 0.02 |
E(X) = (0)(0.8) + (500)(0.1) + (5,000)(0.08) + (15,000)(0.02) = 750
So the owner can expect to lose $750 on average per year. Any insurance company must charge more than this amount to make a profit.
And while $750 might not sound that bad, is the risk of losing $15,000 really worth it? That's why most car owners buy more than the basic insurance - not because it's a good deal (it isn't - the insurance cost will be more than the expected loss) but because it gives the owner piece of mind.
Example 8
Gambling is full of expected value calculations. We already did one earlier about roulette (and saw that the game has a negative expectation for the player). Let's try another one, but this time make it more a game of skill.
There are many variations of poker, but most involve rounds of betting, where players have to choose what to bet, and whether to "call" (pay the amount bet by another player). One relatively simple situation to look at is the final round of betting.
Let's suppose you're in a poker game with the great Doyle Brunson. It's the last play of the hand - Doyle has bet $50 and you have to decide whether or not to call. There's $250 in the middle of the table if you call and win. If you call and lose, you'll lose another $50.
Doyle has been around a long time, so you can't be sure if he's bluffing. If you call and he is, you win the $250 in the middle and his additional $50. If you call and he's not bluffing, you lose your additional $50.
Based on the way the hand has played out, you think there's about a 20% chance he has nothing, and an 80% chance that he has you beat. What is the expected value of calling Doyle's bet?
Solution: There's a lot going on here, but let's start like we've done in the past. We'll make a random variable, call it X, with possible values of $300 (you call and win), and -$50 (you call and lose).
E(X) = ($300)(0.2) + (-$50)(0.8) = $20
So on average, if we were to replay this hand over and over, we'd expect an average profit of $20 over time. So yes, we should call. Keep in mind, we're still going to lose 80% of the time, but the 20% of the time we win is enough to make it worth the while.
Here's one more for you.
Example 9
Suppose you have an investment opportunity. A new small business in town is looking for investors, and they're asking for a $20,000 investment from you. After some investigating, you determine that with the current economic climate, there's a 40% chance the company will fail in the first year, and you'll lose the full $20,000. There's about a 50% chance the company will struggle but survive, and you'll have a loss of about $5,000. There is an opportunity in the field, though, and you guess there's about a 10% chance that the company can make it big, and you'll quadruple your investment in the first year.
Based on these estimates, should you make the investment?
Here's a way to use expected value:
Let X = return on investment.
X can take on values of -$20,000, -$5,000, and $80,000. The expected value of X is then:
E(X) = (-20,000)(0.4) + (-5,000)(0.50) + (80,000)(0.10)
= -$2,500
Since you have an expected profit of -$2,500, it looks like you're better off waiting for the next opportunity.
The Standard Deviation of a Random Variable
Although we're usually much more interested in the expected value (mean) of a random variable, there are times (especially later on in the course) that we'll also be interested in the standard deviation. The formula is similar to the mean in that it weights each value by its corresponding probability.
The Variance and Standard Deviation of a Discrete Random Variable
The variance of a discrete random variable is given by the formula
![]()
where x is the value of the random variable and P(x) is the probability of observing the random variable x.
To find the standard deviation of the discrete random variable, take the square root of the variance.
We'll just do one quick example of standard deviation.
Example 10
Let's consider our example again with the two dice.

We know from earlier this section that the expected value is 7. Using that, we can find the variance and standard deviation.

And so the standard deviation is: ![]()
