Section 2.3: Graphical Misrepresentations of Data
Objectives
By the end of this section, you will be able to...
- describe what can make a graph misleading or deceptive
For a quick overview of this section, watch this short video summary:
Misleading and Deceptive Graphs
Example 1
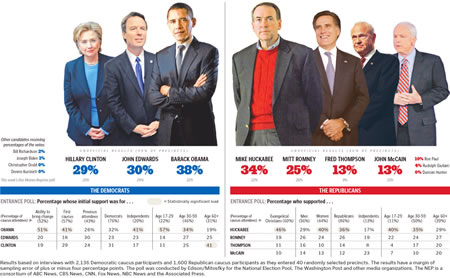
This first one was from the Washington Post after the Iowa caucuses in January, 2008. Look carefully at the graphic and try to determine what was misleading about it.

This graph is misleading because it appears we're supposed to interpret the height of the candidates as corresponding to the percent of votes they received. Looking at the Republicans, the graphic makes it seem as though John McCain is fairly close to Mike Huckabee. In reality, he only received 13% of the votes, compared to Huckabee's 34%.
Example 2
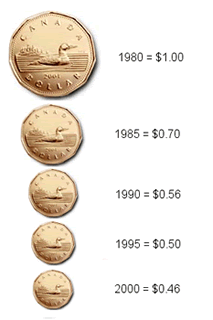
This next graphic is attempting to relate the purchasing power of the Canadian dollar (also known as the "Loonie" - I love that!) in relation to the U.S. dollar. This is a bit more subtle. Can you see what's misleading about this?

This one has to do with the area of the coins. The radius of the top coin looks about 3 times the radius of the bottom. Recalling our geometry, A = π r2. Using this formula, triple the radius actually means 9 times the area!
I believe what the intent here was to make the coin twice as tall. Unfortunately, that isn't really representative of the actual size.
Incidentally, in 2008, the Canadian dollar caught back up with U.S. dollar!
Example 3
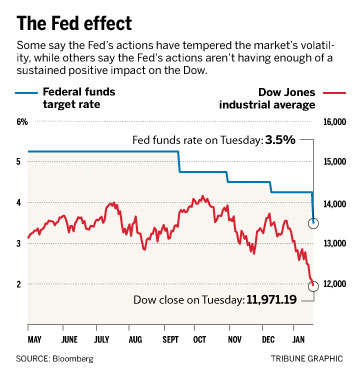
Here's a classic graphic from the Chicago Tribune. This is very typical of graphics representing the stock market. Can you see what's wrong?

I think so. Let me see if I'm right.
To show a steep decrease in the market, most graphics change the vertical scale. (Look at the market value scale on the right.)
This isn't a significant issue. The quick way to correct this is simply to put some sort of mark on that axis to indicate a break. You'll rarely see this in print, though.
Look for this error next time whenever you read an article that's trying to show how quickly something is increasing or decreasing.
